Monitoring Performance Metrics and Analytics on Amazon: 2025 Edition Ultimate Guide for Sellers
Table of Contents
Understanding the Power of Analytics for Amazon Sellers
In today’s hyper-competitive Amazon marketplace, successful sellers aren’t just working harder; they’re working smarter by leveraging data. Analytics have become the backbone of e-commerce success, transforming gut feelings into strategic decisions and guesswork into calculated moves. For Amazon sellers, understanding performance metrics and analytics isn’t just helpful; it’s essential for survival and growth.
Analytics provide sellers with crucial insights into customer behavior, product performance, and operational efficiency. Rather than making decisions based on assumptions, data-driven sellers can identify exactly which products are performing well, which marketing strategies are delivering results, and where operational bottlenecks exist. This precision allows for targeted improvements that directly impact the bottom line.
To unlock the full value of analytics, many leading brands rely on marketplace integration solutions such as Channelinker’s analytics and reporting features to consolidate, interpret, and automate their Amazon data streams. Channelinker enables sellers to move beyond manual reporting, turning analytics into actionable business improvements.
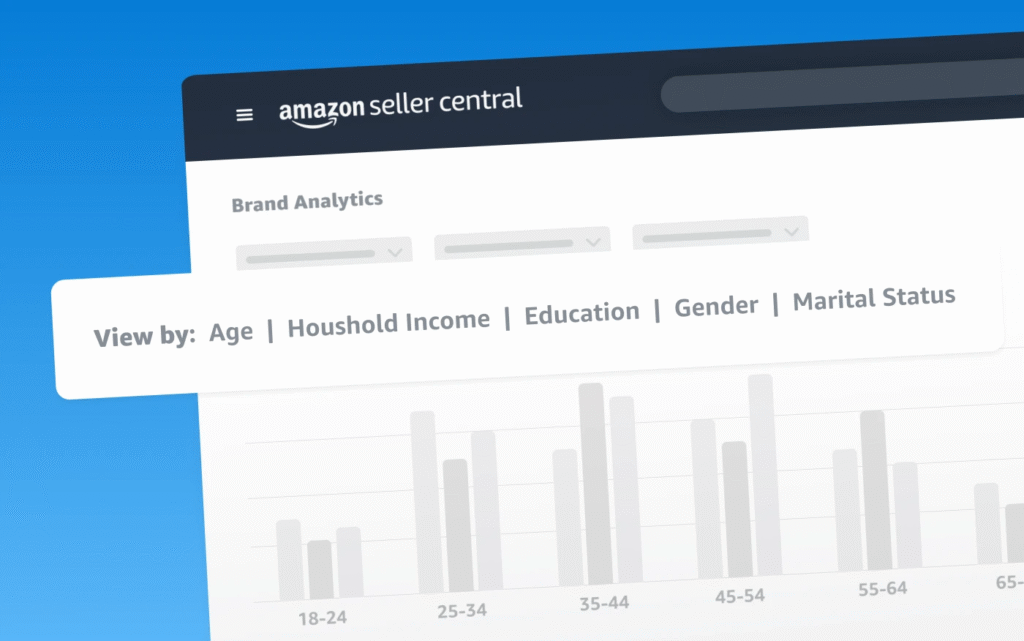
According to SellerApp, Amazon Brand Analytics, launched in 2019, provides sellers with comprehensive data to understand customer purchasing behavior, allowing them to make informed decisions about inventory, pricing, and marketing strategies. This level of insight was previously unavailable to most sellers, creating a new competitive landscape where data literacy translates directly to market advantage.

Essential Key Performance Indicators (KPIs) Every Seller Should Track
Key Performance Indicators (KPIs) are quantifiable measurements that help Amazon sellers evaluate their business performance against strategic objectives. For e-commerce businesses, particularly those operating on Amazon, tracking the right KPIs is essential for sustainable growth and profitability.
KPIs serve as navigational tools that connect day-to-day operations with long-term business goals. They transform raw data into actionable insights, allowing sellers to make informed decisions rather than relying on gut feelings. Each KPI should align with specific business objectives, whether that’s increasing market share, improving profitability, or enhancing customer satisfaction.
Amazon KPIs can be categorized into four main areas:
- Sales KPIs: These metrics track revenue generation and include total sales, average order value (AOV), and product performance. According to Jungle Scout, conversion rate is one of the most critical sales KPIs, measuring the percentage of page visitors who make a purchase. A healthy Amazon conversion rate typically ranges from 10-15% for Prime-eligible products.
- Marketing KPIs: These metrics evaluate the effectiveness of your promotional efforts and include advertising cost of sale (ACoS), total advertising cost of sale (TACoS), click-through rates (CTR), and keyword ranking. Marketing KPIs help optimize your ad spend and improve product visibility.
- Operational KPIs: These metrics assess the efficiency of your business processes and include inventory turnover, fulfillment costs, and Amazon’s Inventory Performance Index (IPI). The IPI is particularly important as it affects storage limits and can impact your ability to send inventory to fulfillment centers.
- Customer Service KPIs: These metrics gauge customer satisfaction and include feedback score, product rating, and order defect rate (ODR). Maintaining strong customer service metrics is crucial for preserving your selling privileges on Amazon.
To establish an effective KPI measurement framework:
- Identify your business objectives: Determine what success looks like for your Amazon business.
- Select relevant KPIs: Choose metrics that directly relate to your objectives.
- Set realistic targets: Establish benchmarks based on industry standards and your historical performance.
- Implement tracking systems: Utilize Amazon Seller Central and third-party analytics tools.
- Review regularly: Schedule weekly or monthly reviews to assess performance and make adjustments.
“Amazon KPIs will give your insight into your Amazon Account Health, including everything from product pricing, marketing strategies, customer satisfaction, and overall business performance,” notes Saras Analytics, emphasizing the comprehensive nature of a well-rounded KPI strategy.
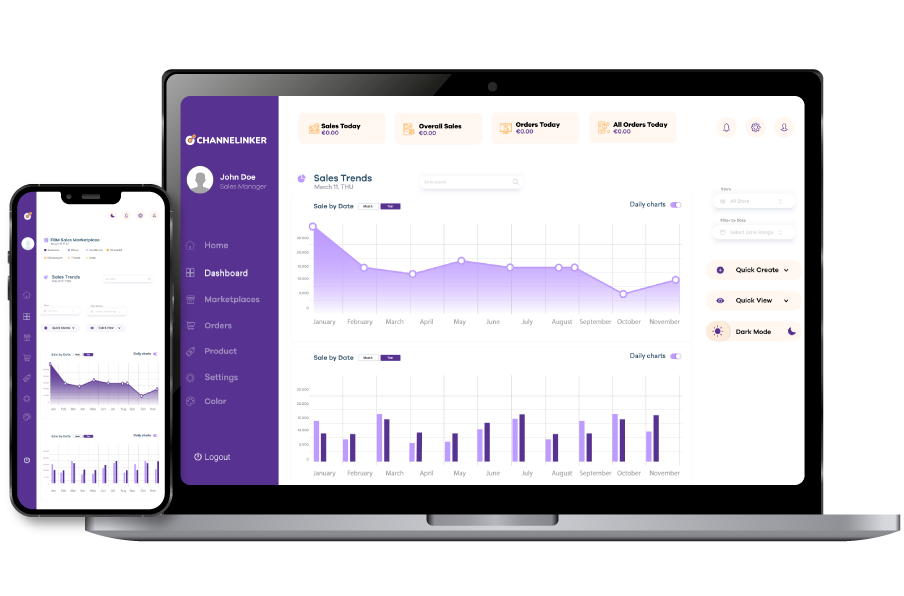
Channelinker’s centralized dashboard brings together all your Amazon KPIs in one place, offering real-time monitoring of sales, inventory, and advertising metrics across multiple marketplaces. With Channelinker, you can set up automated alerts and reports to ensure no critical KPI ever goes unnoticed.
Learn more about Channelinker’s order and performance management tools designed for scaling e-commerce operations.
By systematically tracking these essential KPIs, Amazon sellers can identify strengths and weaknesses in their business model, spot emerging trends, and make data-driven decisions that drive sustainable growth in the competitive marketplace.

Sales and Revenue Metrics That Drive Business Growth
Understanding your sales and revenue metrics is fundamental to growing your Amazon business. These metrics provide critical insights into what’s working, what needs improvement, and where opportunities exist for expansion.
Total Sales
Total sales represents the gross revenue generated by your products before any fees or costs are deducted. Tracking this metric daily, weekly, and monthly helps identify patterns and anomalies in your business performance. Pay special attention to:
- Day-of-week variations
- Monthly growth or decline rates
- Year-over-year comparisons
- Sales during promotional periods versus regular periods
Average Order Value (AOV)
Your AOV indicates how much customers typically spend in a single transaction. Increasing this metric can significantly boost revenue without necessarily acquiring new customers.
According to My Amazon Guy, there are several effective strategies to increase AOV, including cross-linking products in your Brand Story and adding comparison charts in A+ Content. These tactics help customers discover complementary products, encouraging them to add more items to their cart .
Sales by SKU
Breaking down sales by individual SKUs reveals which products are your top performers and which might be underperforming. This granular view allows you to:
- Identify your bestsellers for potential expansion
- Spot declining products that may need optimization
- Recognize opportunities for bundle creation
- Make informed inventory purchasing decisions
Seasonal Trends
Most products experience some degree of seasonality. By analyzing historical sales data across different timeframes, you can:
- Prepare inventory levels for high-demand periods
- Develop marketing strategies for slower seasons
- Time product launches to coincide with peak demand
- Avoid stockouts during crucial selling periods
Viral Launch suggests that understanding these seasonal patterns is crucial for creating effective bundle offers and discount strategies that can increase your average order value during both peak and off-peak seasons (https://viral-launch.com/blog/tips-for-selling-on-amazon/increase-amazon-average-order-value/).
Product Category Performance
Analyzing performance by product category helps you understand where your business strengths lie. This metric reveals:
- Which categories drive the most revenue
- Opportunities to expand successful categories
- Underperforming categories that may need attention
- Potential new categories worth exploring
Revenue Growth Rates
Tracking your growth rate over time provides perspective on your business trajectory. Calculate this metric by comparing revenue across equivalent time periods:
- Month-over-month growth
- Quarter-over-quarter growth
- Year-over-year growth
A declining growth rate may signal market saturation or increased competition, while accelerating growth could indicate product-market fit or successful marketing efforts.
Profit Margins
Revenue alone doesn’t tell the complete story—understanding your profit margins is crucial. Track:
- Gross profit margin (revenue minus cost of goods)
- Net profit margin (after all Amazon fees and operational costs)
- Margin trends over time
- Margin differences between products and categories
ROI Calculations
Return on Investment calculations help you understand the efficiency of your spending across different business areas:
- Advertising ROI (ROAS)
- Inventory investment ROI
- Product development ROI
- Overall business ROI
By consistently monitoring these sales and revenue metrics, you’ll develop a comprehensive understanding of your business performance and identify specific areas for improvement. The most successful Amazon sellers make data-driven decisions based on these key indicators, allowing them to allocate resources efficiently and maximize profitability.
Traffic and Visibility Metrics: Understanding Your Audience
Understanding how customers find and interact with your listings is crucial for optimizing your Amazon business. Traffic and visibility metrics provide valuable insights into your audience’s behavior and the effectiveness of your product listings.
Page Views and Unique Visitors
Page views represent the total number of times your listings have been viewed, while unique visitors count individual shoppers who have viewed your products. A high number of page views with low unique visitors suggests repeat visits, potentially indicating strong interest but hesitation to purchase. Monitor these metrics in Amazon Seller Central to identify products that attract attention but may need optimization to convert browsers into buyers.
Traffic Sources
Amazon provides data on where your traffic comes from, including:
- Amazon organic search
- External sources (social media, blogs, etc.)
- Sponsored product ads
- Product recommendation widgets
Understanding your traffic sources helps allocate marketing resources effectively. If most of your sales come from Amazon organic search, focus on optimizing keywords and product listings. If external traffic converts well, consider expanding your off-Amazon marketing efforts.
Session Duration and Browse-to-Buy Ratio
Session duration measures how long shoppers spend viewing your listings. Longer sessions often indicate greater interest, while very short sessions might suggest your listing isn’t meeting customer expectations. The browse-to-buy ratio (sometimes called “session percentage”) represents how many browsing sessions result in purchases. According to SellerApp, the average Amazon conversion rate is between 10-15%, with top-performing listings reaching up to 15% (https://www.sellerapp.com/blog/amazon-conversion-rate-guide/).
Search Rank Position
Your product’s position in search results dramatically impacts visibility and sales. Products appearing on the first page of search results capture the vast majority of clicks. Track your rank position for key search terms to understand your competitive position and the effectiveness of your SEO efforts.
Impressions vs. Clicks
Impressions measure how many times your product appears in search results, while clicks count how many times shoppers clicked on your listing. The click-through rate (CTR) is the percentage of impressions that result in clicks. A low CTR may indicate that your main image, title, or pricing isn’t compelling enough compared to competitors.
PPC Performance Metrics
For sellers using Amazon’s advertising platform, key metrics include:
- Cost per click (CPC)
- Advertising cost of sales (ACoS)
- Return on ad spend (ROAS)
- Conversion rate
These metrics help optimize your advertising strategy. According to AIHello, Prime members have a significantly higher conversion rate of over 74% compared to non-Prime customers, which may influence your targeting strategy (https://www.aihello.com/resources/blog/amazons-conversion-rate-everything-you-need-to-know-2024/).
Channelinker integrates with your Amazon account to provide real-time traffic analytics, page view data, and listing optimization insights. Its automated keyword and SEO analysis tools help ensure your product pages are optimized for both Amazon’s algorithm and external traffic sources.
For more details, explore Channelinker’s listing optimization solutions.
By regularly monitoring these traffic and visibility metrics, you can identify opportunities to improve your product listings, optimize your marketing efforts, and ultimately increase your sales on Amazon. Set up a routine to review these metrics weekly or monthly, looking for patterns and testing improvements based on the data.
Conversion Rate Analysis and Optimization Strategies
Conversion rate is one of the most critical metrics for Amazon sellers, representing the percentage of visitors who complete a desired action; typically making a purchase. On Amazon, in 2024, the average conversion rate across all product categories is approximately 9.87%, though this figure varies significantly by niche and product type.
Understanding your conversion rate begins with a simple formula: divide the number of conversions (purchases) by the total number of visitors, then multiply by 100. For Amazon sellers, this metric provides crucial insights into listing effectiveness and overall sales performance.
Several factors influence your Amazon conversion rate:
- Product Listing Quality: High-quality images, detailed descriptions, and compelling bullet points significantly impact conversion.
- Pricing Strategy: Competitive pricing relative to similar products can dramatically affect purchase decisions.
- Reviews and Ratings: Products with more positive reviews typically convert at higher rates.
- Buy Box Percentage: Winning the Buy Box is essential for conversion optimization. When you own the Buy Box, your product becomes the default purchase option when customers click “Add to Cart.” Monitoring and improving your Buy Box percentage should be a priority, as it directly correlates with increased sales volume.
- Stock Availability: Out-of-stock items or delayed shipping can negatively impact conversion rates.
To optimize your conversion rate, implement these proven strategies:
A/B Testing Methodologies
Systematic testing of different elements of your product listings helps identify what resonates with customers. Test one variable at a time; whether it’s the main image, title format, or pricing strategy—to determine which version performs better. Amazon’s Manage Your Experiments tool allows sellers to run split tests on A+ content for brand-registered accounts.
Product Page Optimization
Focus on enhancing every element of your product page:
- Create benefit-driven bullet points that address customer pain points
- Use high-resolution images showing the product from multiple angles
- Craft detailed product descriptions that answer common questions
- Include size charts, compatibility information, and usage instructions where relevant
Cart Abandonment Reduction
While Amazon handles much of the checkout process, sellers can still reduce abandonment by:
- Ensuring pricing is transparent with no surprising fees
- Offering competitive shipping options
- Addressing potential objections in the product description
- Providing excellent customer service to build trust
According to recent data, a good Amazon advertising conversion rate typically falls between 8-12%, though this benchmark varies based on product category and keyword targeting. By consistently monitoring your conversion metrics and implementing these optimization strategies, you can work toward exceeding industry averages and maximizing your Amazon sales potential.

Customer Metrics That Reveal Long-Term Business Health
Understanding your customer behavior is essential for long-term success on Amazon. While sales metrics provide immediate performance insights, customer metrics offer a deeper understanding of your business’s sustainability and growth potential.
Customer Lifetime Value (CLV)
Customer Lifetime Value represents the total revenue you can expect from a single customer throughout their relationship with your business. Calculating CLV helps you determine how much you can reasonably spend to acquire new customers while remaining profitable.
To calculate basic CLV:
- Determine your average order value
- Multiply by the average purchase frequency
- Multiply by the average customer lifespan
This calculation becomes increasingly important as your business scales. According to research, increasing customer retention by just 5% can boost profits by 25-95%, highlighting the significant impact of loyal customers on your bottom line (https://www.sarasanalytics.com/blog/customer-retention-strategy-by-amazon).
Repeat Purchase Rate
Your repeat purchase rate indicates the percentage of customers who make additional purchases after their initial order. This metric directly correlates with customer satisfaction and product quality. A high repeat purchase rate suggests strong customer loyalty and reduces your dependency on constantly acquiring new customers.
To calculate repeat purchase rate:
- Divide the number of customers who purchased more than once by your total number of customers
- Multiply by 100 to get a percentage
Customer Retention Strategies
Effective retention strategies are crucial for Amazon sellers. Consider implementing:
- Personalized follow-up emails
- Loyalty programs or incentives for repeat purchases
- Product quality improvements based on customer feedback
- Strategic pricing to encourage repeat business
For Amazon sellers specifically, retention strategies are becoming increasingly important as fulfillment costs rise. With Amazon’s FBA fulfillment fees increasing by approximately 5% and advertising costs (CPCs) rising by as much as 50% year-over-year, retaining existing customers is more cost-effective than acquiring new ones (https://www.nozzle.ai/insights/increasing-retention-rate-matters-amazon-sellers).
Review Rates and Sentiment Analysis
Monitor both the quantity and quality of your reviews. Key metrics include:
- Review rate (percentage of purchases that result in reviews)
- Average star rating
- Sentiment trends over time
- Common themes in positive and negative feedback
Use sentiment analysis tools to identify patterns in customer feedback that may not be immediately apparent from ratings alone. This data provides invaluable insights for product improvements and marketing messaging.
Customer Service Response Times
Fast, effective customer service directly impacts retention. Track:
- Average response time to customer inquiries
- Resolution time for issues
- Customer satisfaction with support interactions
Amazon prioritizes sellers with excellent customer service metrics in their algorithm, making this an important factor for overall visibility and success.
Brand Loyalty Indicators
Beyond direct purchase metrics, monitor indicators of brand loyalty:
- Social media engagement
- Email marketing open and click-through rates
- Participation in brand-specific promotions
- Referral traffic and conversions
By comprehensively tracking these customer metrics, you’ll gain insights into your business’s long-term health and identify specific areas for improvement that drive sustainable growth and profitability.
Leveraging Amazon Seller Central Analytics Tools
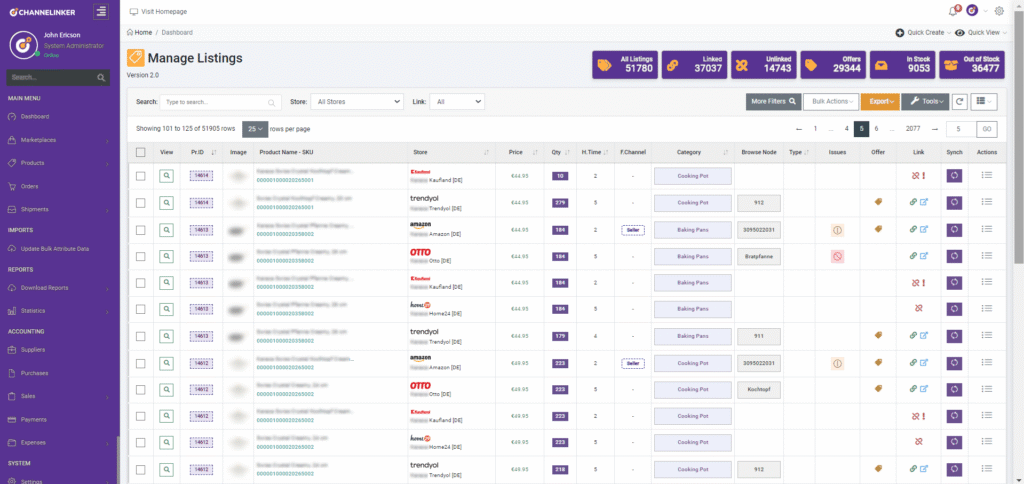
Amazon Seller Central provides a robust suite of built-in analytics tools that give sellers valuable insights without requiring additional investments. The Business Reports dashboard serves as your command center, offering comprehensive data on sales, traffic, and inventory performance all in one place. These reports can be customized by date range and exported for deeper analysis in spreadsheet software.
One of the most powerful features is the Inventory Performance Index (IPI), which evaluates your inventory management efficiency through a single score. This metric helps you identify excess inventory, improve sell-through rates, and fix listing issues that might be affecting your sales performance. According to Amazon, maintaining a healthy IPI score above 400 can qualify you for unlimited storage, making this a critical metric to monitor.
The detailed page reports provide granular data about how customers interact with your product listings. You can track page views, conversion rates, and buy box percentage—essential metrics for optimizing your listings and improving visibility. For FBA sellers, the dedicated FBA reports offer insights into inventory status, reimbursements, and customer returns, helping you manage the logistics side of your business more effectively.
Customer service metrics like feedback ratings, response times, and order defect rates are also readily available. These metrics not only affect your account health but also influence your product rankings and buy box eligibility. According to SellerApp, sellers who regularly monitor and optimize these metrics see up to 30% improvement in overall performance compared to those who don’t leverage these tools.
While Amazon Seller Central provides foundational reports, Channelinker takes your analytics to the next level by merging data from Amazon, Shopify, Walmart, and more, making it easy to benchmark performance across every channel in your sales ecosystem.
By regularly reviewing these built-in analytics, you can identify trends, spot potential issues before they become problems, and make data-driven decisions that positively impact your bottom line—all without leaving the Seller Central ecosystem.
Third-Party Analytics Tools to Enhance Your Data Strategy
While Amazon Seller Central provides essential analytics capabilities, many sellers find that third-party tools offer deeper insights and more powerful features to gain a competitive edge. These specialized tools can help you uncover hidden opportunities and automate tedious analytical tasks.
Helium 10 stands out as one of the most comprehensive analytics solutions for Amazon sellers. According to Revenue Geeks, it’s considered the “best overall Amazon analytics tool because of its all-around suite that helps Amazon sellers track profits, keywords, and markets”. What makes Helium 10 particularly valuable is its ability to consolidate multiple analytical functions that would otherwise require several different tools.
Most third-party analytics platforms offer integration capabilities that allow you to pull data from multiple sources, including Amazon Seller Central, advertising platforms, and even your own website. This creates a centralized dashboard where you can view all your performance metrics in one place, saving valuable time and providing a more holistic view of your business.
Advanced features not typically available in Seller Central include:
- Competitor analysis tools that track your rivals’ pricing strategies, inventory levels, and keyword rankings
- Profit analytics that factor in all costs (including Amazon fees, shipping, and advertising) to show true profitability
- Predictive analytics that forecast sales trends and inventory needs
- Automated alerts for inventory issues, price changes, or review problems
- Keyword tracking and optimization recommendations
When considering third-party tools, conduct a thorough cost-benefit analysis. While premium analytics platforms may seem expensive initially, the insights they provide often lead to significant revenue increases that justify the investment. Many tools offer tiered pricing plans that allow you to start with basic features and upgrade as your business grows.
The automation capabilities of these tools can dramatically reduce the time spent on data analysis. Features like automated report generation, scheduled email updates, and real-time alerts ensure you stay informed about critical metrics without constant manual monitoring. This allows you to focus on strategic decision-making rather than data collection and processing.
Before selecting a tool, take advantage of free trials to ensure the platform meets your specific needs and integrates well with your existing systems. The right analytics tool should feel like an extension of your team, providing actionable insights that directly contribute to business growth.
Setting Up an Effective Analytics Dashboard
Creating an effective analytics dashboard is crucial for Amazon sellers who want to make data-driven decisions quickly. A well-designed dashboard provides at-a-glance visibility into your business performance and helps identify trends that might otherwise go unnoticed.
When setting up your dashboard, start by customizing it to display only the most relevant metrics for your business goals. Different roles within your organization may need different views—marketing teams might focus on advertising performance and traffic sources, while operations teams need inventory levels and fulfillment metrics.
According to Geckoboard, an effective ecommerce dashboard should give stakeholders “a complete overview of the metrics they need to run successful campaigns for an online store” (https://www.geckoboard.com/dashboard-examples/ecommerce/). This means carefully selecting KPIs that directly impact your business decisions rather than tracking everything possible.
For visualization best practices, remember that simplicity is key. Use clear charts and graphs that communicate information at a glance:
- Bar charts for comparing values across categories
- Line graphs for showing trends over time
- Pie charts for displaying proportional data
- Gauge charts for metrics with specific targets
Establish regular reporting routines to ensure your dashboard data informs your business strategy. Weekly reviews can help identify short-term issues, while monthly or quarterly analyses reveal longer-term trends. As noted by Coupler.io, many ecommerce businesses struggle with “difficulty tracking progress” and “time-consuming reporting”, making automated dashboards particularly valuable.
Set up automated alerts for significant metric changes to stay proactive. Configure notifications when key metrics like conversion rates, sales velocity, or inventory levels cross predetermined thresholds. This allows you to respond quickly to both opportunities and challenges.
For Amazon sellers specifically, consider creating dashboard sections for:
- Sales performance (daily, weekly, monthly trends)
- Inventory health and restock alerts
- Advertising campaign effectiveness
- Competitor price monitoring
- Customer feedback and ratings
Remember that your dashboard should evolve as your business grows. Regularly review which metrics provide actionable insights and be willing to adjust your dashboard accordingly. The goal isn’t just to collect data but to transform it into business intelligence that drives growth.

Seasonal and Trend Analysis for Strategic Planning
Understanding seasonal patterns and market trends is crucial for Amazon sellers who want to stay ahead of demand fluctuations. By analyzing historical data and recognizing cyclical patterns, you can make informed decisions about inventory, pricing, and marketing strategies.
Seasonal analysis begins with examining your sales data across different timeframes—monthly, quarterly, and annually. Look for consistent patterns that emerge year after year, such as holiday shopping spikes, summer slumps, or back-to-school rushes. Amazon Seller Central provides tools that can help you visualize these patterns through customizable date range comparisons.
Year-over-year comparisons are particularly valuable for identifying growth trends and seasonal shifts. By comparing this year’s performance to the same period last year, you can spot emerging opportunities or potential concerns. This comparative analysis helps you distinguish between normal seasonal fluctuations and genuine business growth or decline.
Amazon’s demand forecast tool is an invaluable resource for sellers planning their inventory strategy. According to Amazon Seller Central, this tool “provides you with an estimate of future demand for your products for up to 40 weeks” using machine learning algorithms that analyze historical sales data and market trends .
For more sophisticated trend analysis, many Amazon sellers turn to third-party analytics platforms. These tools can help you identify not just when demand spikes occur, but why they happen and how to capitalize on them. As noted by eStore Factory, “Platforms like Jungle Scout, Helium 10, and Keepa offer detailed market analysis and trend forecasting, giving you a clearer picture of expected seasonal demand.
When forecasting future demand, consider these key methodologies:
- Historical projection: Using past sales data to predict future performance
- Market trend incorporation: Adjusting forecasts based on industry trends
- Competitor analysis: Monitoring competitors’ stock levels and pricing strategies
- External factor assessment: Considering economic conditions, upcoming events, or product lifecycle stages
Effective inventory planning based on these forecasts can help you avoid both stockouts and excess inventory. Create buffer stock calculations for your highest-selling products during peak seasons, and develop contingency plans for unexpected demand spikes.
Remember that forecasting is never perfect—the goal is to reduce uncertainty, not eliminate it entirely. Regularly review your forecasting accuracy by comparing predicted versus actual sales, and refine your methodology over time. By making seasonal and trend analysis a core part of your Amazon business strategy, you’ll be better positioned to capitalize on opportunities and minimize risks throughout the year.
Competitor Analysis Through Available Metrics
Understanding your competition is crucial for thriving in Amazon’s competitive marketplace. Effective competitor analysis helps you identify gaps in the market, optimize your pricing strategy, and differentiate your products from competitors.
Ethical Competitive Intelligence Gathering
Ethical competitive intelligence involves analyzing publicly available data about your competitors without crossing legal or ethical boundaries. Amazon provides several metrics that allow you to gather this intelligence legitimately:
- Best Seller Rankings (BSR): Track competitors’ BSR changes over time to understand their sales velocity
- Product reviews and ratings: Analyze sentiment and common feedback
- Search ranking positions: Monitor where competitors appear for your target keywords
Tools like Jungle Scout offer comprehensive competitive intelligence features that help you benchmark your brand against competitors and identify growth opportunities. Their platform allows you to track market share and monitor competitor performance metrics ethically and efficiently.
Market Share Estimation
Estimating your market share on Amazon provides valuable context for your business performance:
- Define your product category or niche specifically
- Identify all major competitors within that space
- Use analytics tools to estimate sales volumes
- Calculate your percentage of total category sales
AMZScout, available through Nozzle.ai’s suite of tools, helps sellers analyze competition and estimate sales volumes, giving you clearer insight into your relative market position (https://www.nozzle.ai/amazon-seller-tools/amazon-competitor-analysis-tool).
Competitive Pricing Analysis
Price is often a decisive factor for Amazon shoppers. Monitoring competitors’ pricing strategies helps you:
- Identify your price position relative to market averages
- Spot patterns in competitors’ discount strategies
- Determine optimal price points for your products
- Recognize when competitors are testing price elasticity
Product Feature Comparison Through Reviews
Customer reviews provide invaluable insights into how your products compare to competitors:
- Identify features customers appreciate in competing products
- Spot common complaints or issues with competitor offerings
- Discover unmet needs you can address in your product development
- Understand which product attributes drive positive sentiment
Brand Positioning Assessment
Understanding how competitors position their brands helps you differentiate effectively:
- Analyze competitors’ brand messaging and unique selling propositions
- Evaluate their visual branding elements and consistency
- Assess their customer service reputation through reviews
- Identify gaps in the market where you can establish a unique position
By systematically analyzing these competitive metrics, you’ll gain actionable insights that inform your product development, marketing strategy, and pricing decisions—ultimately helping you carve out a stronger position in the Amazon marketplace.

Using Analytics to Optimize Your Advertising Strategy
For Amazon sellers, advertising is often a significant investment that requires careful monitoring and optimization. By leveraging performance metrics and analytics, you can transform your advertising strategy from a guessing game into a data-driven approach that maximizes return on investment.
Understanding ACOS: The North Star of Ad Performance
Advertising Cost of Sale (ACOS) is perhaps the most critical metric for measuring ad efficiency on Amazon. It represents the ratio of ad spend to generated sales, expressed as a percentage. According to Jungle Scout, “An average ACOS is between 25% to 40%, while a high ACOS is above 40%”.
To calculate ACOS, use this simple formula:
ACOS = (Ad Spend ÷ Ad Revenue) × 100
For example, if you spend $100 on ads and generate $500 in sales, your ACOS would be 20%.
Setting Profitable ACOS Targets
The key to successful advertising is understanding what ACOS level is profitable for your business. Amazon Advertising recommends that “In order to maintain a profit, your Amazon ACOS needs to be lower than your profit margin. Otherwise, you will be spending more on ads than you’re earning.
For new product launches, you might accept a higher ACOS to gain visibility and reviews. For established products, aim for a lower ACOS to maximize profitability.
Beyond ACOS: Total Advertising Cost of Sale (TACOS)
While ACOS measures the direct return on ad spend, TACOS provides a more holistic view by considering your total sales, including organic ones. This metric helps you understand how advertising impacts your overall business performance.
TACOS = (Ad Spend ÷ Total Sales) × 100
A decreasing TACOS over time often indicates that your advertising is helping boost organic sales through improved product ranking and visibility.
Keyword Performance Analysis
Effective advertising requires continuous analysis of keyword performance. Track metrics such as:
- Impression count
- Click-through rate (CTR)
- Conversion rate
- Cost per click (CPC)
- Sales per click
Identify which keywords drive the most conversions at the lowest cost, and reallocate your budget accordingly. Consider pausing keywords with high spend but low conversion rates, while increasing bids on high-performing terms.
Bid Optimization Strategies
Use performance data to implement smart bidding strategies:
- Dayparting: Adjust bids based on the time of day when conversion rates are highest
- Placement adjustments: Increase bids for top-of-search placements if they show better conversion rates
- Device targeting: Allocate more budget to desktop or mobile based on performance data
- Negative keyword refinement: Regularly review search term reports to identify irrelevant terms
Campaign ROI Measurement
Move beyond simple ACOS tracking to measure true ROI by considering:
- Product costs
- Amazon fees
- Shipping costs
- Customer acquisition cost
- Customer lifetime value
This comprehensive approach ensures you’re investing in campaigns that drive genuine business growth, not just sales volume.
Implementing a Testing Framework
Establish a structured approach to testing ad variables:
- Create control and test campaigns
- Change only one variable at a time
- Run tests for at least 7-14 days
- Document results systematically
- Scale successful strategies across your account
By continuously testing and optimizing based on performance data, you can steadily improve the efficiency of your advertising spend and gain a competitive edge in the marketplace.

Data-Driven Inventory Management
Inventory management is perhaps the most critical area where analytics can dramatically impact your Amazon business profitability. With the right metrics and analysis, sellers can maintain optimal stock levels, reduce costs, and maximize sales opportunities.
Inventory Turnover Rates
Inventory turnover measures how quickly you sell and replace inventory within a specific period. Higher turnover rates typically indicate efficient inventory management, while lower rates might suggest overstocking or weak demand. Calculate this metric by dividing the cost of goods sold by average inventory value. Most successful Amazon sellers aim for 4-6 inventory turns per year, though this varies by category.
Stockout Prevention
Stockouts can devastate your business through lost sales, decreased search rankings, and damaged customer relationships. Analytics help prevent these scenarios by establishing reorder triggers based on historical sales velocity. According to Amazon, Effective inventory management keeps stock levels optimized to meet customer demand” while preventing costly stockouts that can harm your seller metrics.
Storage Fee Optimization
FBA storage fees can quickly erode profits if not carefully managed. Analytics tools can identify which products incur disproportionate storage costs relative to their sales performance. Amazon’s Inventory Health Report is particularly valuable for this analysis, as it highlights aging inventory that may be accruing excessive fees. Consider removing or repositioning slow-moving inventory to reduce these costs .
Seasonal Inventory Planning
Historical sales data reveals seasonal patterns that should guide your inventory decisions. By analyzing year-over-year trends, you can anticipate demand spikes and adjust purchasing accordingly. Remember that Amazon’s storage fees typically increase during peak seasons (October-December), making accurate forecasting even more crucial for profitability.
Reorder Point Calculation
Analytics enable precise reorder point calculations based on lead time, sales velocity, and safety stock requirements. The formula typically includes:
Reorder Point = (Average Daily Sales × Lead Time) + Safety Stock
By automating this calculation through analytics tools, you ensure timely reordering without manual monitoring.
Slow-Moving Inventory Identification
Analytics help identify inventory that’s tying up capital without generating adequate returns. Establish thresholds for slow-moving items (such as products with less than 1 unit sold per month) and create action plans for these SKUs—whether through price reductions, bundling, or removal from FBA.
Implementing a data-driven inventory management strategy requires consistent monitoring and adjustment. Set aside time weekly to review your inventory metrics and make informed decisions that balance availability with cost efficiency. The most successful Amazon sellers understand that inventory management isn’t a set-it-and-forget-it task but an ongoing optimization process guided by analytics.
Implementing a Testing Culture for Continuous Improvement
Embracing a testing culture is essential for Amazon sellers who want to stay competitive in an ever-evolving marketplace. A/B testing, also known as split testing, provides a methodical approach to optimize product listings and improve performance metrics over time.
A/B testing involves comparing two versions of your product listing to determine which one performs better in terms of conversion rates, click-through rates, or other key metrics. According to ADBrew, this methodology allows sellers to make data-backed decisions rather than relying on gut feelings or assumptions about what works.
To implement an effective testing culture, follow these steps:
- Establish clear testing objectives: Before running any test, define what metric you’re trying to improve and what success looks like.
- Test one element at a time: Focus on testing individual elements such as titles, main images, bullet points, or product descriptions to clearly identify what drives changes in performance.
- Develop a testing schedule: Create a calendar for systematic testing throughout the year, allowing for seasonal variations and giving each test sufficient time to gather meaningful data.
- Ensure statistical significance: For reliable results, tests should run long enough to achieve statistical significance—typically at least 7-14 days depending on your sales volume.
- Document and share results: Keep detailed records of all tests, results, and insights to build institutional knowledge within your team.
Amazon’s “Manage Your Experiments” feature offers sellers a native tool for conducting A/B tests on A+ Content, while third-party tools can help test other listing elements. According to SalesDuo, successful sellers typically test multiple elements throughout the year, with main product images and titles often yielding the highest impact on conversion rates (https://salesduo.com/blog/amazon-ab-testing-guide/).
When measuring the impact of changes, focus on:
- Conversion rate improvements
- Click-through rate changes
- Overall sales velocity
- Changes in average session duration
- Impact on organic ranking
By implementing a systematic approach to testing, you create a feedback loop that continuously improves your listings based on actual customer behavior rather than assumptions. This data-driven methodology ensures that every change you make to your listings is backed by evidence, leading to incremental improvements that compound over time and ultimately drive better performance across all your key metrics.
Future-Proofing Your Business with Advanced Analytics
The e-commerce landscape is constantly evolving, with new technologies and methodologies emerging that can give sellers a competitive edge. To stay ahead in the Amazon marketplace, forward-thinking sellers are increasingly turning to advanced analytics solutions that go beyond basic reporting.
Introduction to Predictive Analytics
Predictive analytics represents the next frontier for Amazon sellers seeking to anticipate market changes rather than simply react to them. Unlike traditional analytics that tell you what happened in the past, predictive analytics uses historical data patterns to forecast future outcomes. By implementing predictive models, sellers can anticipate demand fluctuations, identify emerging product trends, and optimize inventory levels before problems arise.
According to recent research, “By forecasting demand patterns and market trends, businesses can make strategic decisions that optimize operations and resource allocation” (https://www.graas.ai/blog/predictive-analytics-in-ecommerce-a-complete-guide-2024). This proactive approach allows Amazon sellers to reduce costs associated with overstocking while minimizing the risk of stockouts that can damage seller ratings.
Machine Learning Applications for E-commerce
Machine learning algorithms are revolutionizing how Amazon sellers analyze and utilize their data. These sophisticated tools can process vast amounts of information to identify patterns that human analysts might miss. Key applications include:
- Product recommendation engines that analyze customer browsing and purchase history to suggest relevant products
- Dynamic pricing algorithms that automatically adjust prices based on competitor activity, demand fluctuations, and inventory levels
- Customer segmentation tools that identify high-value customer groups for targeted marketing campaigns
- Churn prediction models that flag customers at risk of abandoning your brand
These applications allow sellers to deliver personalized shopping experiences at scale, optimizing both customer satisfaction and profit margins.
Emerging Trends in E-commerce Data Analysis
The analytics landscape is rapidly evolving with several key trends poised to reshape how Amazon sellers leverage data:
- Integration of IoT devices that will provide deeper insights into customer behavior and preferences
- Voice analytics capabilities as voice shopping becomes more prevalent
- Visual search analytics to understand how customers discover products through images
- Real-time analytics processing allowing for immediate response to market changes
“Looking ahead, several trends are poised to shape the future of e-commerce analytics. The integration of IoT devices, for example, will enable retailers to gather more comprehensive data about consumer behavior and preferences” (https://eaglytics-co.com/the-future-of-e-commerce-analytics-predictive-insights-and-consumer-behavior/).
Preparing for Amazon Algorithm Changes
Amazon regularly updates its search and recommendation algorithms, which can dramatically impact seller visibility and sales. Advanced analytics can help sellers weather these changes by:
- Monitoring performance metrics across multiple dimensions to quickly identify the impact of algorithm updates
- Developing predictive models that anticipate how algorithm changes might affect specific product categories
- Creating diversified traffic and conversion strategies that reduce dependence on any single Amazon feature
- Building robust testing frameworks to quickly adapt listing content to new algorithm preferences
Sellers who develop these capabilities will be better positioned to maintain and grow their market share despite platform changes.
Frequently Asked Questions (FAQs) about Amazon Seller Analytics
What is Amazon Brand Analytics and how does it help sellers?
Amazon Brand Analytics is a powerful tool available to brand-registered sellers. It provides detailed data on customer search terms, purchase behavior, and competitive products, allowing sellers to refine their inventory, pricing, and marketing strategies based on real data. By using Brand Analytics, sellers gain a deeper understanding of what drives conversions and can adapt their Amazon seller analytics approach for better results.
How can I track my Amazon seller metrics in multiple marketplaces?
Tracking Amazon seller metrics across global marketplaces like the US, Canada, and Europe requires an integrated analytics solution. With tools like Channelinker, you can monitor performance metrics, inventory levels, and advertising ROI across all your Amazon accounts in one dashboard, simplifying your global analytics and reporting.
Which are the most important KPIs for Amazon sellers to monitor?
Essential Amazon KPIs include conversion rate, Buy Box percentage, sales by SKU, customer feedback score, and Inventory Performance Index (IPI). Focusing on these key metrics helps sellers optimize their listings, boost sales, and maintain a healthy account status.
How do analytics tools help improve conversion rates on Amazon?
Analytics tools help Amazon sellers identify which product listings, images, or descriptions are underperforming. By analyzing data like session duration, click-through rate, and sales conversion, sellers can implement targeted improvements—such as A/B testing main images or refining bullet points—to increase their conversion rate Amazon-wide.
What is the benefit of integrating Channelinker with Amazon analytics?
Channelinker provides centralized reporting for Amazon seller metrics, automates critical performance alerts, and connects data from multiple platforms including ERP, 3PL, and other marketplaces. This holistic view enables sellers to make faster, data-driven decisions, improving efficiency and profitability across every Amazon marketplace they sell on.
How can I analyze traffic sources to my Amazon listings?
Amazon Seller Central offers basic insights into traffic sources, but for advanced analytics—including external channels like social media or Google Ads—integrated solutions such as Channelinker or Amazon Attribution provide a more detailed breakdown. This allows sellers to understand where their customers are coming from and invest in the most effective marketing channels.
Are there regional differences in Amazon analytics tools or available data?
Yes, some Amazon analytics features and reporting tools may vary by country or marketplace. For example, Brand Analytics might be available in the US and Canada but limited in some European regions. Sellers should review Amazon’s official help documentation for region-specific guidance and use analytics tools that support multiple Amazon marketplaces.
How often should Amazon sellers review their performance metrics?
Best practice is to review your Amazon analytics at least weekly. High-volume sellers or those running active promotions may need daily monitoring to react quickly to changes in traffic, conversion rate, or account health.
Conclusion and Action Steps
To future-proof your Amazon business with advanced analytics:
- Start exploring predictive analytics tools designed for e-commerce businesses
- Invest in training or talent that understands both data science and Amazon selling
- Implement a structured approach to testing and learning from your data
- Develop a roadmap for gradually incorporating more sophisticated analytics capabilities
- Stay informed about emerging trends in e-commerce analytics
By embracing advanced analytics now, you’ll build the foundation for sustainable competitive advantage as the Amazon marketplace continues to evolve and mature.
If you are ready to take your Amazon analytics to the next level and future-proof your e-commerce strategy, contact Channelinker’s team for a free demo or strategy session.
For more hands-on tips and advanced marketplace insights, subscribe to our Channelinker blog.